Dynamic Delivery Statistics
- Table of Contents
- Overview
- Filtering and organizing the report
- Data contained within the report
- Charts
- Navigating the reports
- Sharing the report
- Sorting the report
- Caveats
Overview
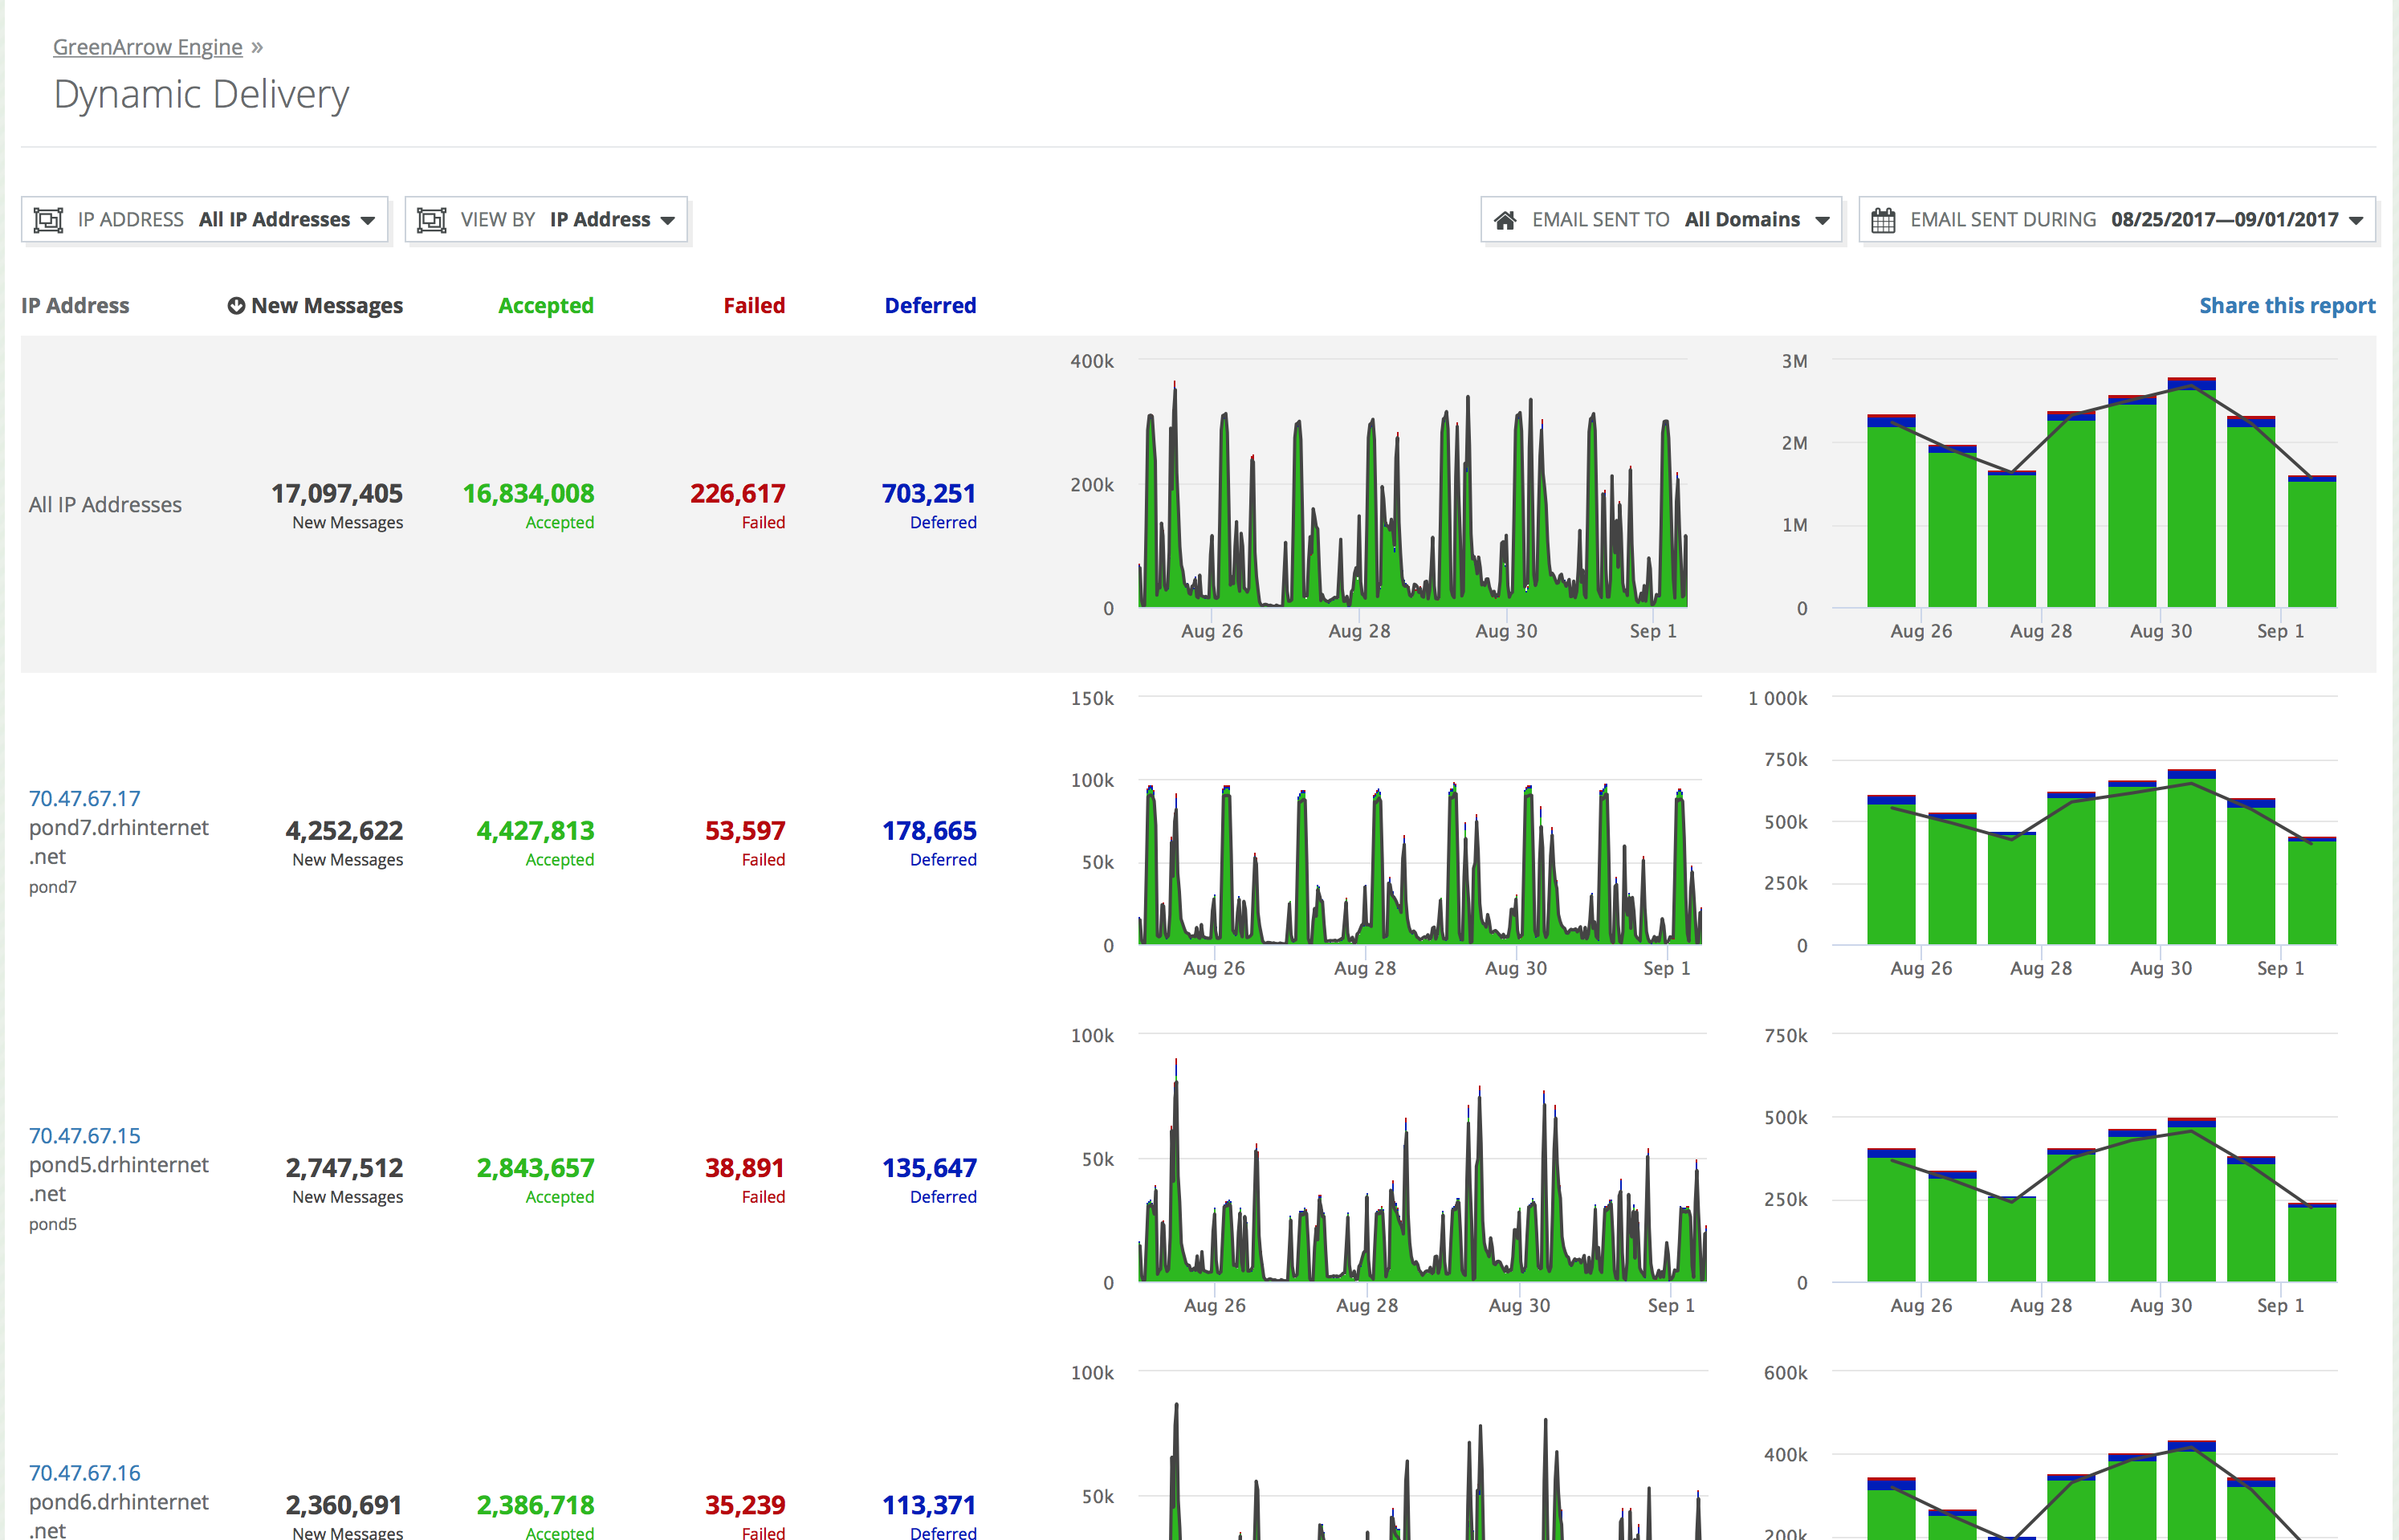
The Dynamic Delivery statistics page provides insight into recent delivery activity in GreenArrow Engine. You may use it to view the performance of IP addresses, relay servers, throttling rules, or results for specific domain names.
The controls in the screen shown below allow you to specify a specific focus. For example:
- Stats on delivery to a particular domain name across all IPs
- Stats on delivery to a particular domain name across all relay servers
- Stats on delivery for the throttling rules containing a particular domain name across all IPs
- Stats on delivery for the domain names with the most volume on a particular IP address
- Stats on delivery for the domain names with the most volume on a particular relay server
- Stats on delivery comparing each IP address
- Stats on delivery comparing each relay server
This page can be accessed by logging into your GreenArrow Engine installation’s web interface, and clicking on the “Dynamic Delivery” link that appears when you mouse over the “Statistics” tab.
Filtering and organizing the report
Filtering and organizing the report is done with the controls on the top line of the page.
Filter by IP address or relay server
Use the “IP ADDRESS” filter to reduce the data to a single IP address. If you’d like to reset to viewing all IP addresses, click the filter again and select “All IP Addresses”.
This filter can also be used to select one or all relay servers. When a relay server is selected, the label will change from “IP ADDRESS” to “RELAY”.
Organize results
Click the “VIEW BY” determines what each row in the report will represent:
VIEW BY: IP Address
This shows a single row for each IP address, providing a summary of the delivery performance of each IP. This option is only available when “All IP Addresses” is selected.
VIEW BY: Relay Server
This shows a single row for each relay server, providing a summary of the delivery performance of each relay server. This option is only available when “All Relay Servers” is selected.
VIEW BY: Domain
When showing all IP addresses or all relay servers: Each row shows stats for a domain name across all IP addresses or relay servers.
When filtering to a single IP address or relay server: This shows a single row for each “monitored domain” in that IP address or relay server.
-
Only domain names that are a “monitored domain” on at least one IP address or relay server are shown. Once a domain name is included in the report data for IP addresses or relay servers on which the domain name is a “monitored domain” are included. The totals row labeled “All Monitored Domains” only includes such domains.
-
A “monitored domain” is any domain on an IP address or relay server that has had more than 100 new messages in a day.
-
Monitored domains are selected on a per-IP basis. If a domain receives sufficient new messages to become a monitored domain on one particular IP address, this does not affect its “monitored domain” status on any other IP.
VIEW BY: Throttle
This option is available only on IP addresses.
When showing all IP addresses: Shows the above rows for all IP addresses combined together in a single report. This allows sorting to find problem throttling rules on any IP.
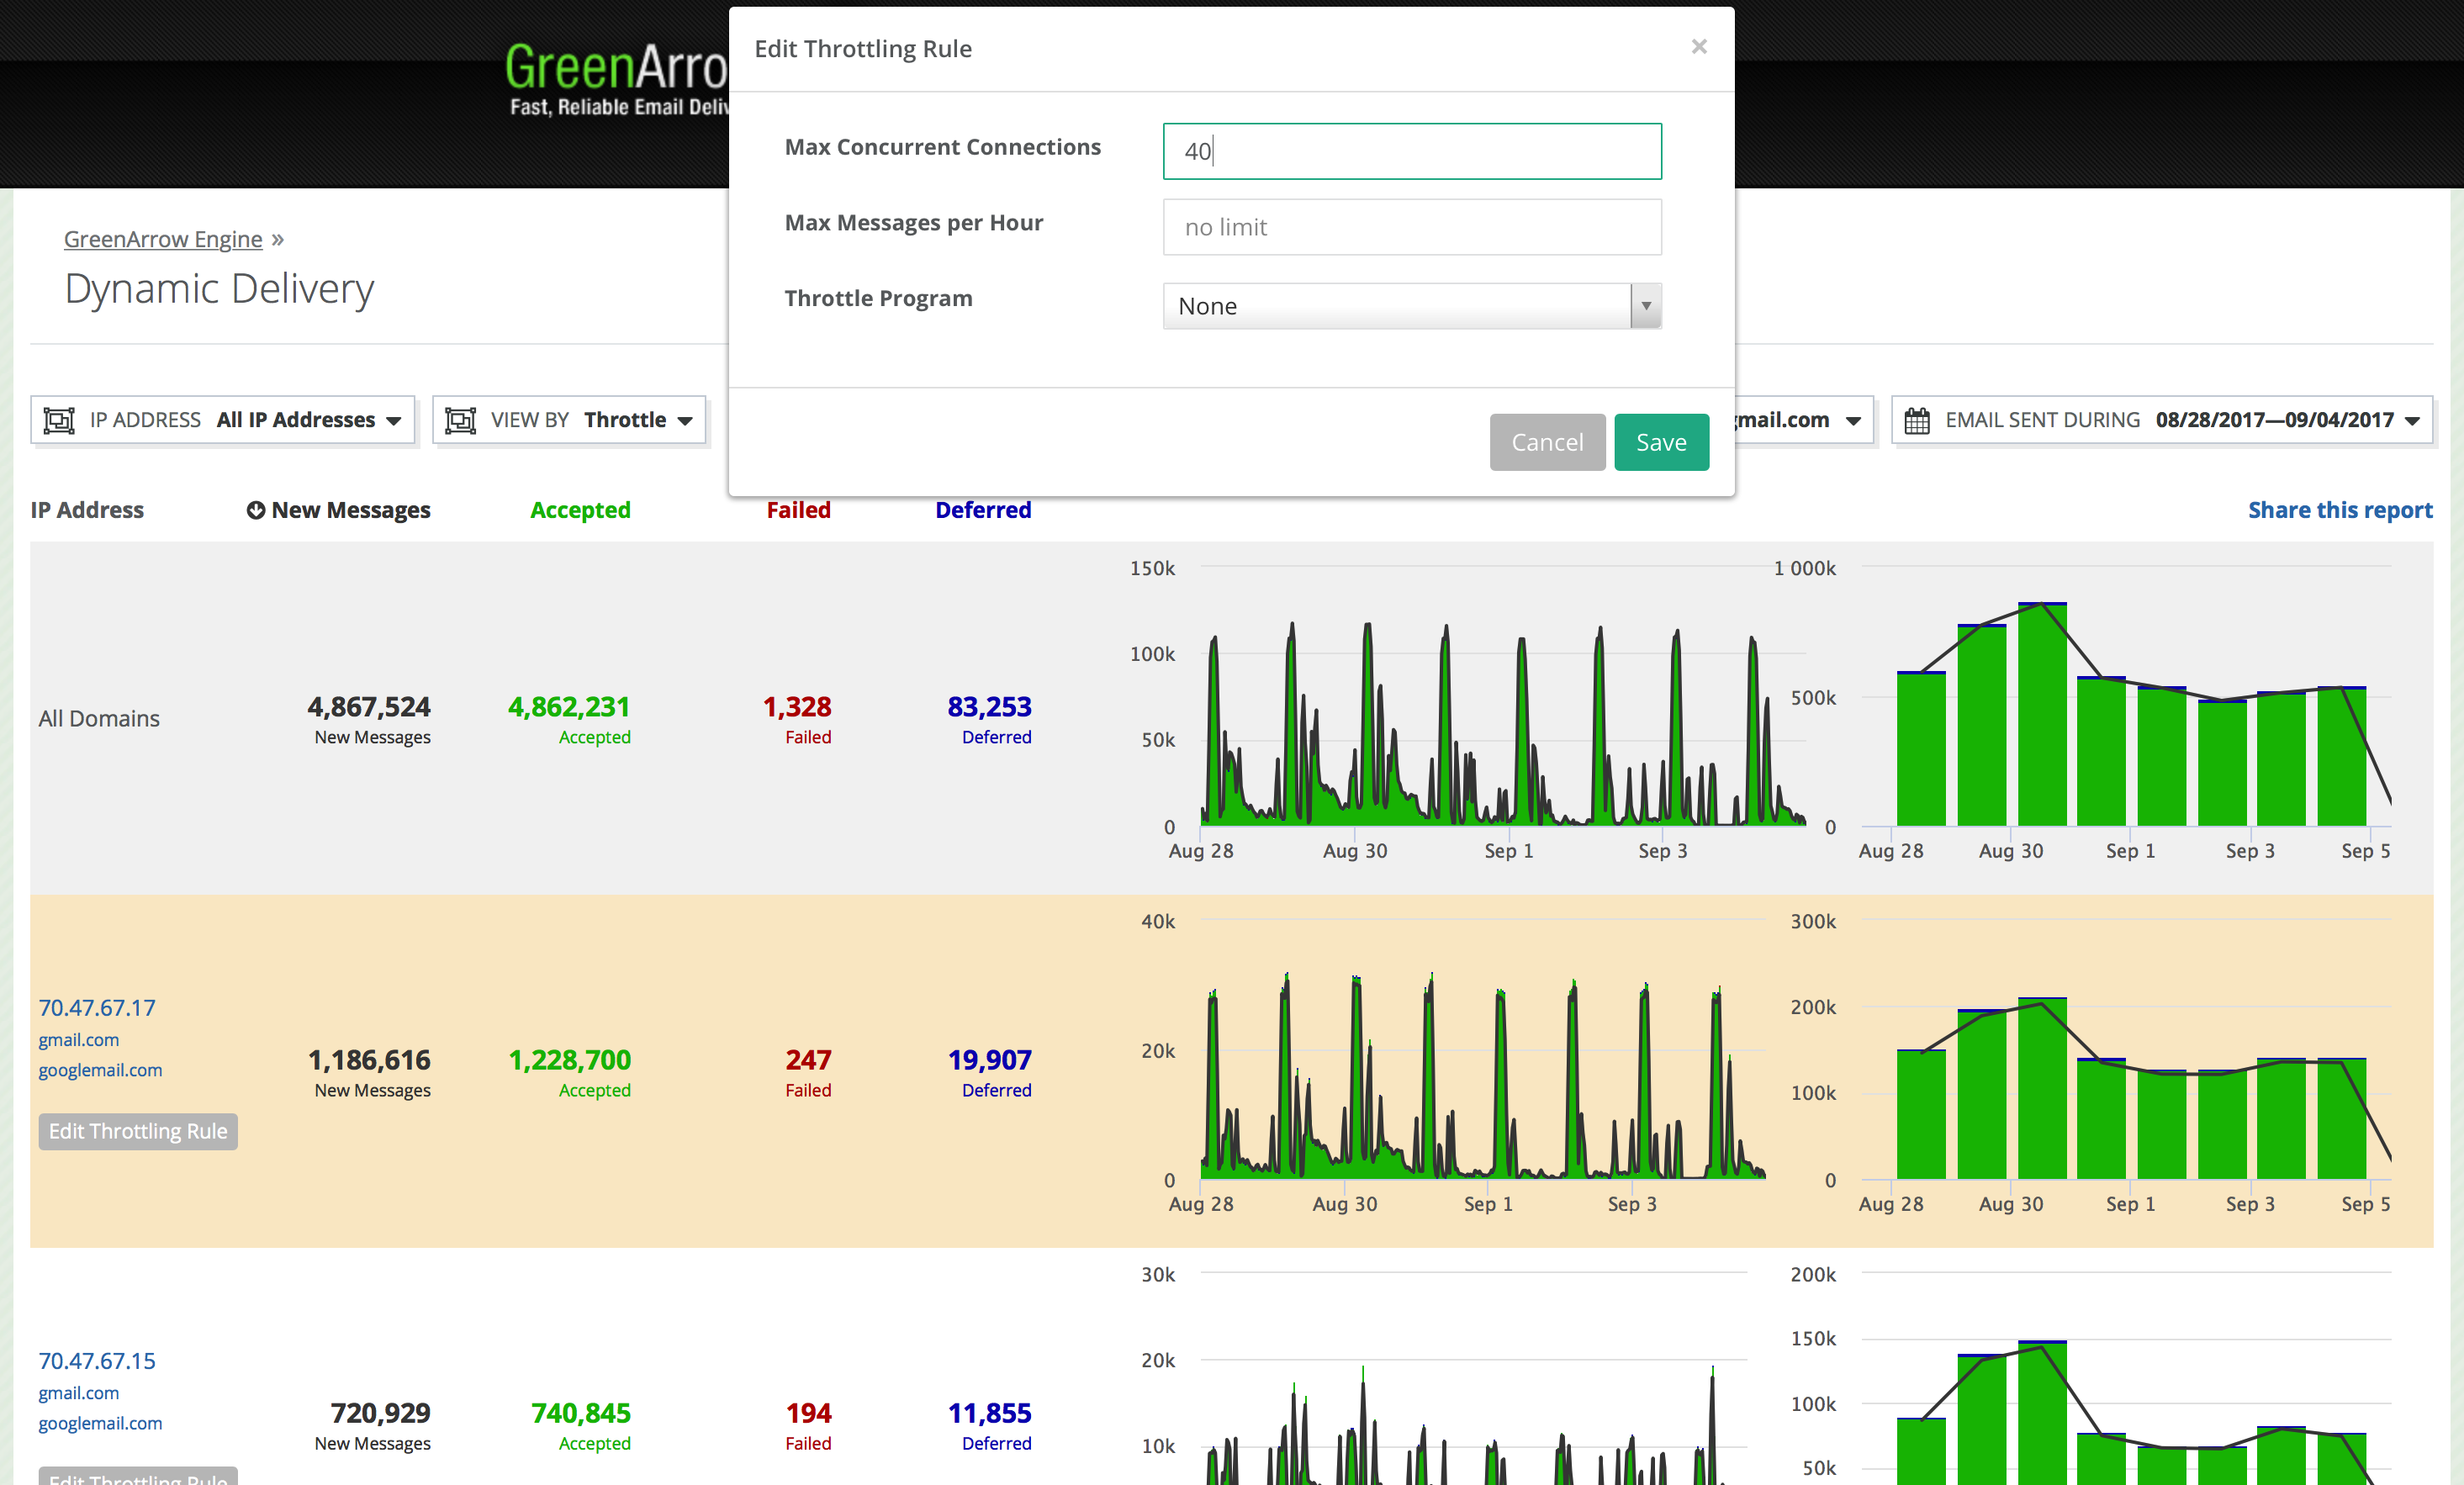
When filtering to an IP address: This shows a single row for each throttling rule of the IP Address. This groups together data for multiple domains where a single throttling rule covers multiple domains. This also allows you to edit the throttling settings directly in this UI. In addition, this report shows data on each “monitored domain” not covered by a throttling rule (and thus covered by the Default Throttling Rule settings of the IP.)
Filter by the recipient domain name
Click the “EMAIL SENT TO” filter to reduce the data to one or more recipient domain names, or to expand it back to all domains.
Change date range
Click the “EMAIL SENT DURING” filter to change the date range covered by the report. Using this filter, you can limit to any of:
- the most recent 1, 6, or 12 hours
- the most recent 1, 3, 7, 14, or 30 days
- a custom date range
Data contained within the report
The following values are displayed for each row of the report.
For relay servers, these statistics pertain to delivery to the relay server itself, not delivery to the final SMTP recipient.
New messages
The number of messages that had their first delivery attempt scheduled on this IP address or relay server.
This includes delivery attempts that were canceled due to throttle limits
(status=connmaxout).
Accepted
The number of messages that were successfully delivered through SMTP.
Failed
The number of permanent delivery failures that occurred after connecting to the SMTP server.
Deferred
The number of temporary delivery failures that occurred after connecting to the SMTP server.
Temporary errors from SMTP servers that are “upgraded” to permanent errors
because the maximum retry time for the message has elapsed
(status=failure_toolong) are counted as deferrals in this reporting, because
the SMTP server returned a temporary error.
Charts
Time Series
Each row in the report shows a graph of a time-history of each of these data points.
The Y-axis of this chart is messages/delivery-attempts per hour. The Accepted, Failed, and Deferred stats are represented as a stacked bar chart, so that the top of the bar-chart colored area represents the rate of delivery attempts per hour.
The smallest slice of time that data is recorded for is 5 minutes. Graphs of larger amounts of total elapsed time may aggregate these 5 minute slices into larger time slices to display on the graph.
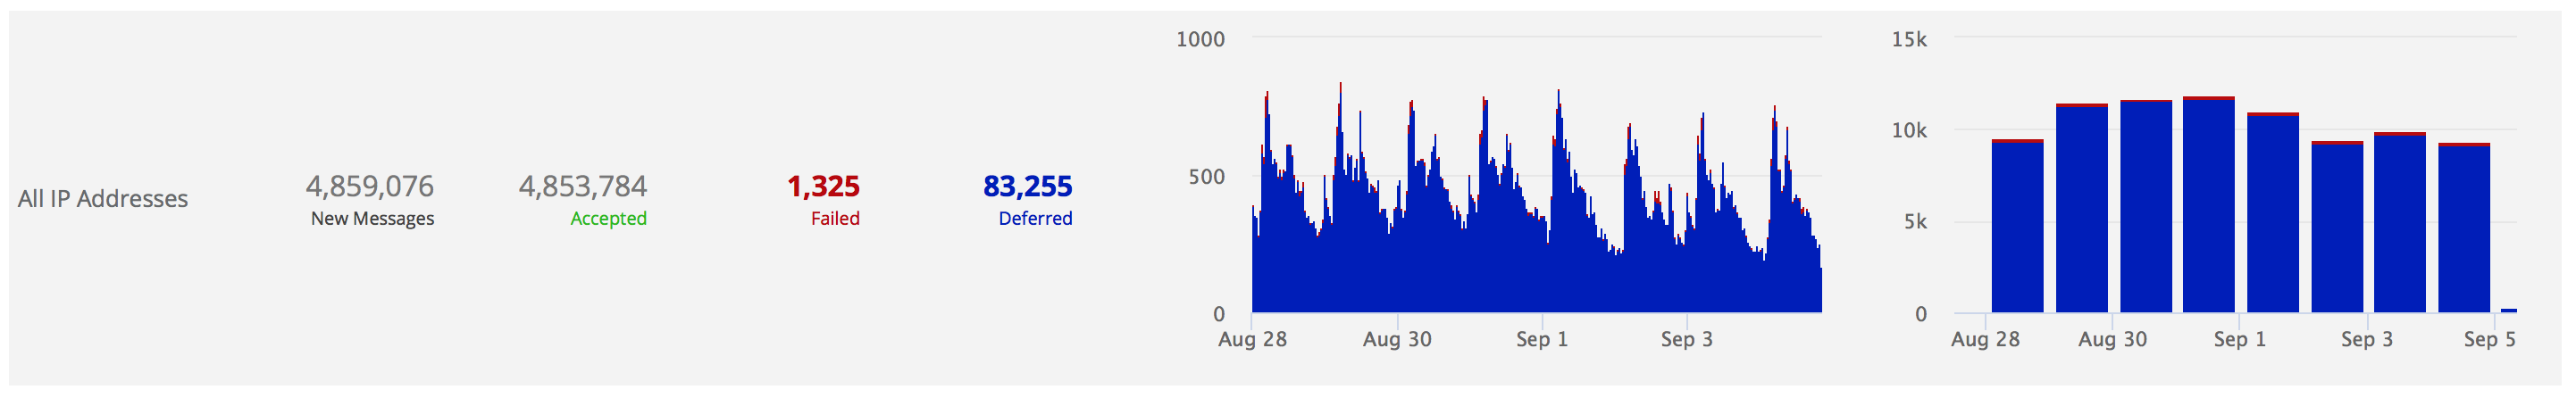
Daily Summary
Date ranges of greater than one day will also include a daily summary graph. In the summary graph the Y-axis is the total number of messages/delivery-attempts per day.
Hiding and showing data
Click on the numeric value for one or more of the four columns to toggle its display in the charts. This can be useful to better visualize deferrals and failures.
View delivery rates for a time slice
To view the delivery rates for a particular slice in the time series, click on the chart. After clicking, a hovering box will appear showing this data.
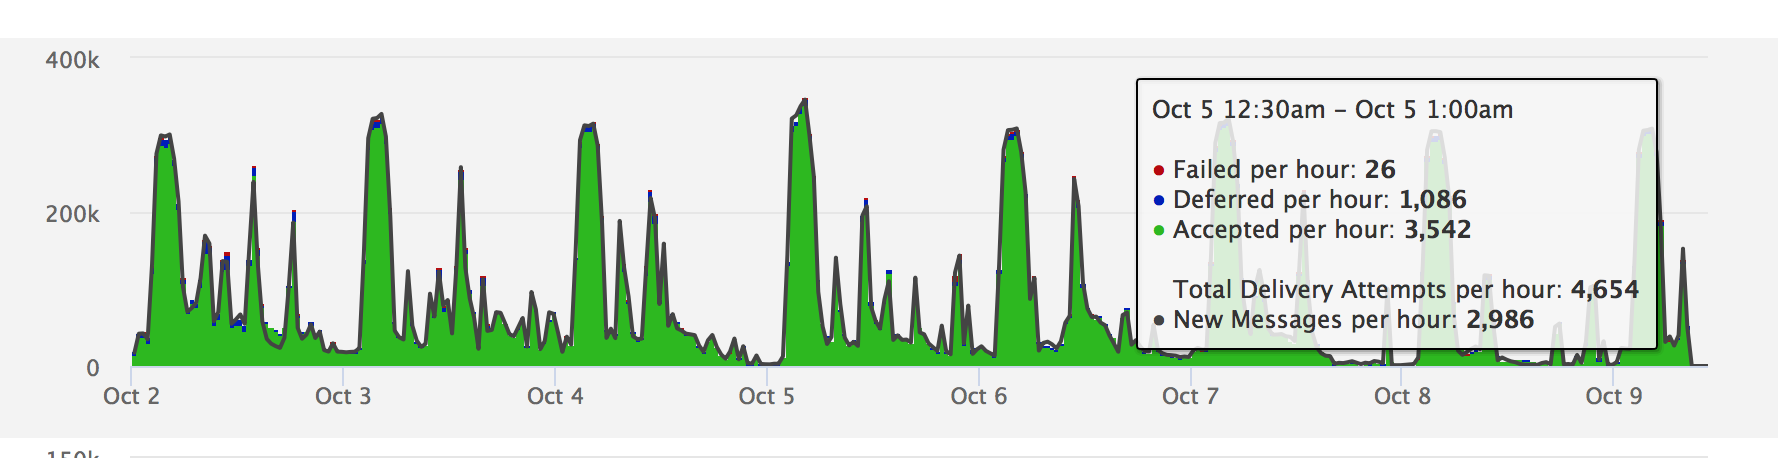
At the top is shown the time range that the hovered slice encompasses. The numbers shown are the rates “per hour” over the course of that time slice. For example if 10 messages were injected over the course of a 5 minute time slice, that slice has a rate of 120 New Messages per hour.
Navigating the reports
These reports support drilling down by clicking in the IP Address / Relay Server / Domain column:
-
When viewing a report organized by IP address, clicking on an individual row will take you to the list of domain names delivered to by that IP.
-
When viewing a report organized by relay server, clicking on an individual row will take you to the list of domain names delivered to by that relay server.
-
When viewing a report organized by domain name, clicking on an individual row will take you to the report for that domain name across all IP addresses or relay servers.
-
When viewing a report organized by throttling rules, clicking on an individual row will take you to that throttling rule’s definition. Additionally, there is a button “Edit Throttling Rule” next to the throttling rule. Clicking this will open a modal dialog to edit the throttling rule’s values.
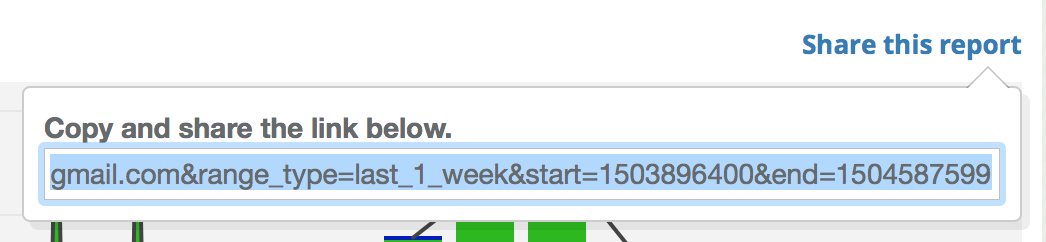
Sharing the report
Click on “Share this report” to receive a URL that can be shared. The shared link will contain the precise date range used in the current report. Viewing the shared URL will require authorization to access GreenArrow Engine.
Bookmarking the URL of this page will preserve the date range selection (for example “last day”) instead of the actual date range.
Sorting the report
Click on any of the headers “New Messages”, “Accepted”, “Failed”, or “Deferred” to sort by that column.
Caveats
These reports may not perform well on systems that have more than 1,000 IP addresses or report filtering/organization selections that include more than 1,000 rows. Using these reports in these cases may result in either slow responses or error messages.