Campaign Statistics
- Table of Contents
- Overview
- Renders / Opens
- Clicks
- Bounces
- Spam Complaints
- Unsubscribes
The Campaign Statistics page presents a detailed set of statistics for an individual campaign.
Overview
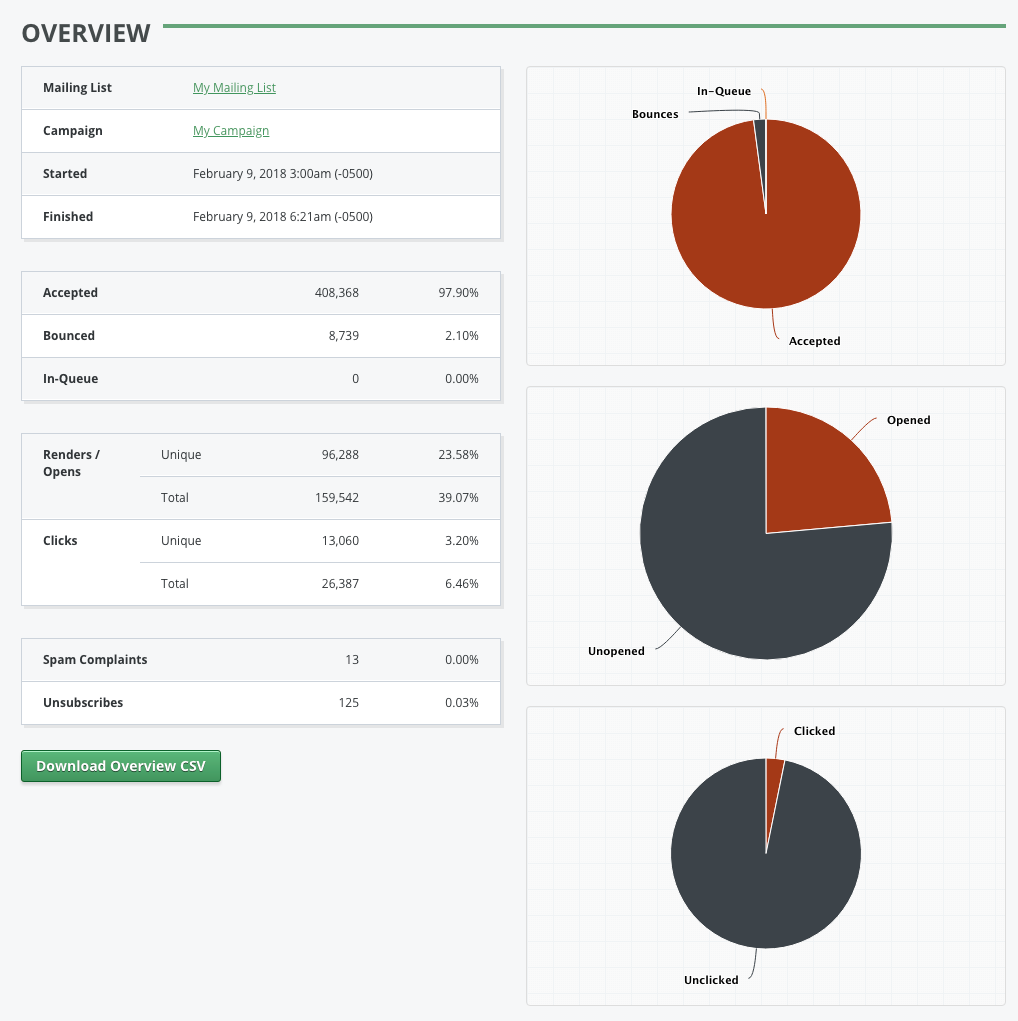
The Overview section displays a summary of key stats, such as when the campaign was sent, and its overall accepted, bounced and in-queue figures:
| Mailing List |
The name of the mailing list that this campaign was sent to. |
||||
| Campaign |
The name of the campaign. |
||||
| Started |
The time that the campaign started sending. |
||||
| Finished |
The time that the campaign’s last message was generated by GreenArrow Studio and handed off to GreenArrow Engine for delivery. Not all messages are delivered to their recipients by this time. See the Accepted, Bounced and In-Queue figures, which are described next for details. |
||||
| Accepted |
The number of emails accepted by remote servers and not later asynchronously bounced. These messages could ultimately be delivered to either the recipient’s Inbox or Spam folder. GreenArrow Monitor can be used to estimate what percentage of messages ultimately end up in the Inbox and Spam folders. |
||||
| Bounced |
The number of emails that bounced. This includes both synchronous and asynchronous bounces. See the Bounce section of the campaign’s stats for details. |
||||
| In-Queue |
The number of messages that are still in GreenArrow’s local mail queue, waiting to be delivered. This number includes messages which have had no delivery attempts made yet, as well as messages which had delivery attempts deferred or throttled. |
||||
Renders / Opens
|
|||||
Clicks
|
|||||
| Spam Complaints |
The total number of spam complaints that were received. The percentage shown is the total figure devided by the number of accepted emails. |
||||
| Unsubscribes |
The total number of unsubscribes that were received. The percentage shown is the total figure devided by the number of accepted emails. |
||||
| Download Overview CSV |
This is the first of a series of “Download” buttons that appear in the report. Each of these buttons links to a CSV file which can be read by applications like Microsoft Excel and LibreOffice Calc. The CSV file that this button links to contains a CSV version of the majority of the stats page that you’re viewing. It omits the information that’s contained in the page’s “History” sections. Each of those “History” sections have “Download” links that you can use if you’d like to download their data as CSV files. |
||||
Renders / Opens
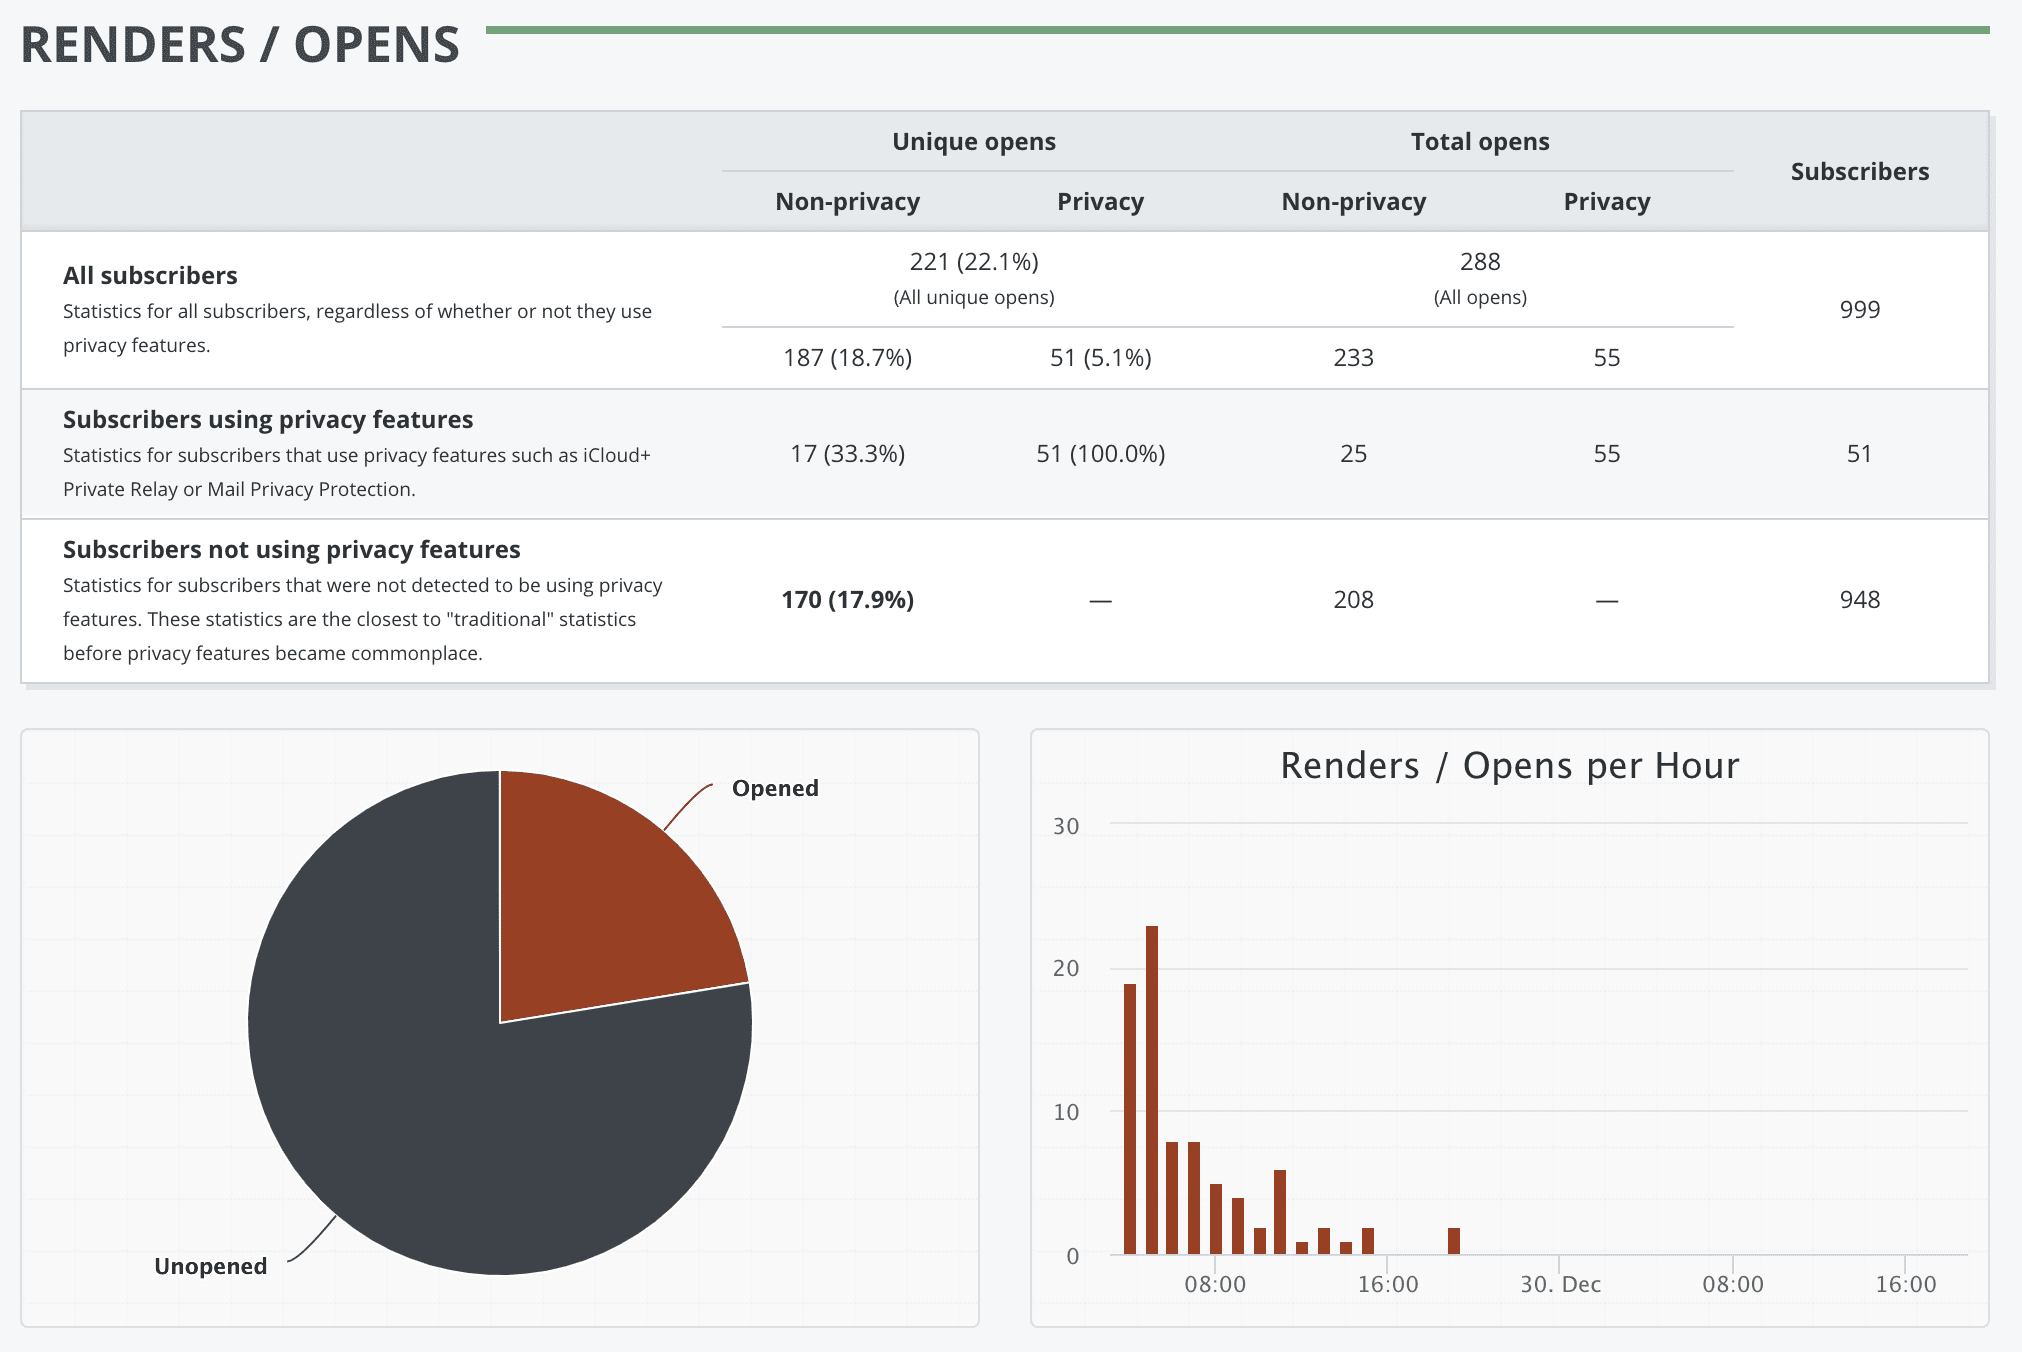
This section provides statistics on renders, sometimes referred to as opens. These get logged each time a subscriber loads images in a campaign. Subscribers who view the campaign, but do not load images are not counted in these figures:
In this section is a table that details opens, broken down by whether or not the subscriber is using privacy features (such as iCloud+ Private Relay or Mail Privacy Protection). Privacy features, when enabled, can automatically load and cache all images in a recipient’s incoming email – including tracking pixels. Additionally, when the email is actually read, no images are loaded from the server but instead served from this cache. This has the effect of artificially inflating open rates.
Each column of the report breaks down the opens by “Non-privacy” and “Privacy” features. Each row breaks down the opens by whether or not the subscriber was detected to be using privacy features. This lets you, for example, view how often a “privacy subscriber” opens your email in a traditional (non-privacy) mail client.
The bolded value (Non-privacy unique opens for subscribers not using privacy features) is the closest approximation to a “traditional” open rate, before privacy features became commonplace.
| Unique Renders / Opens |
The total number of subscribers who loaded the campaign’s images. Each subscriber is only counted once in this figure, regardless of how many times they load images. |
| Render / Open Rate |
The percentage of accepted emails which had images loaded at least once. |
| Total Renders / Opens |
The total number of times that images are loaded for this campaign. If the same subscriber loads images multiple times, each instance gets counted towards the total figure. |
| Duplicate Renders / Opens |
Total Renders minus Unique Renders. |
| Average Recipient Render / Open Ratio |
Total Renders divided by Unique Renders. |
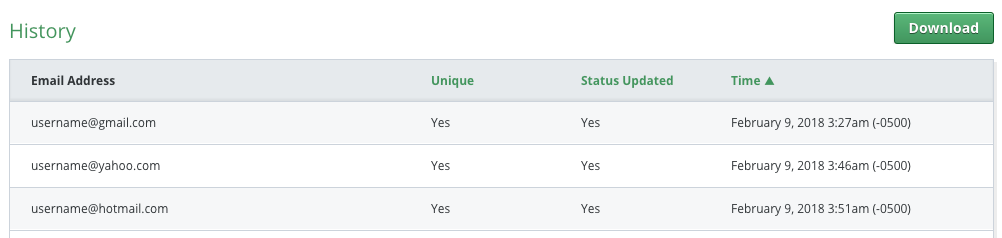
History
This table displays a list of individual renders/opens. This table’s information includes the email address that opened, whether the open was unique, as defined above, the subscriber’s IP address, and the time that the event took place:
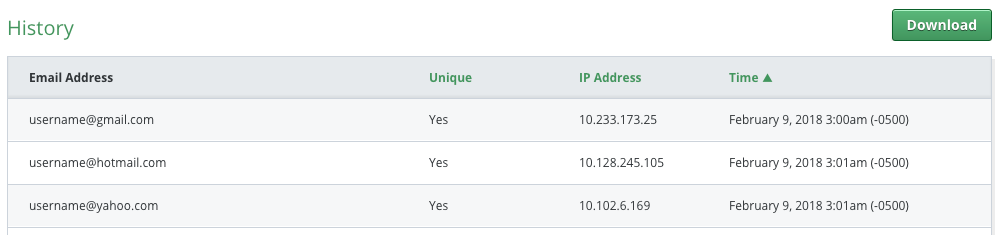
The “Download” link that appears next to the “History” table links to a CSV file containing the table’s data.
Clicks
This section provides statistics on clicks:
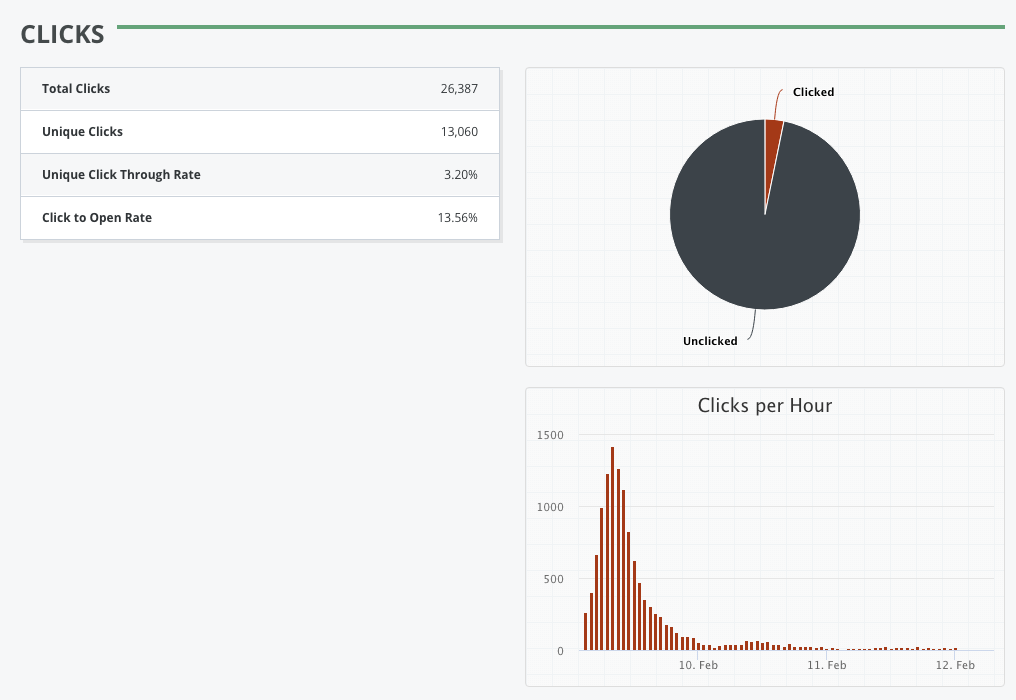
| Total Clicks |
The total number of clicks that took place. If the same subscriber clicks multiple times, each occurrence gets counted. |
| Unique Clicks |
The total number of subscribers who clicked on links. Each subscriber is only counted once in this figure, regardless of how many links they click. |
| Unique Click Through Rate |
The percentage of accepted emails which where clicked at least once. |
| Click to Open Rate |
Unique Clicks divided by Unique Opens. |
Clicks by URL
This table displays the following stats for each URL that one or more clicks were recorded for:
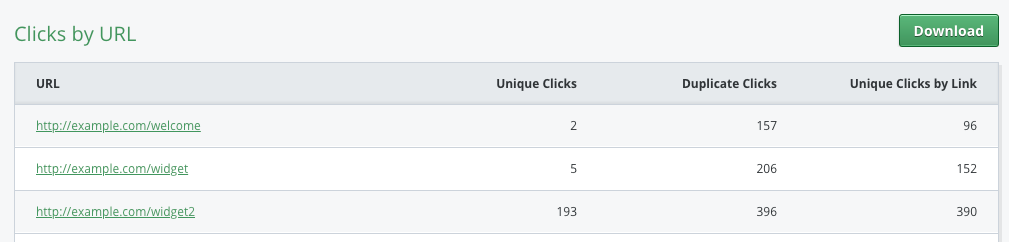
| Download |
Download a CSV file containing this table’s data. |
| URL |
The URL clicked. GreenArrow will display up to the first 50 characters in the table. You can click on the link to visit the original URL. URLs with different query strings, like http://example.com?page=1 and http://example.com?page=2 are separate entries in the table. |
| Unique Clicks |
The total number of subscribers whose first click was this link. All of the “Unique Clicks” figures in this table add up to the number of “Unique Clicks” shown in the previous table for the campaign as a whole. |
| Duplicate Clicks |
The total number of clicks minus unique clicks. |
| Unique Clicks by Link |
The total number of subscribers who clicked on this link. Each subscriber is only counted once, regardless of how many times they click. |
History
This table displays a list of individual clicks. This table’s information includes the email address that clicked, the URL clicked, whether the click was unique, as defined above, the subscriber’s IP address, and the time that the event took place:
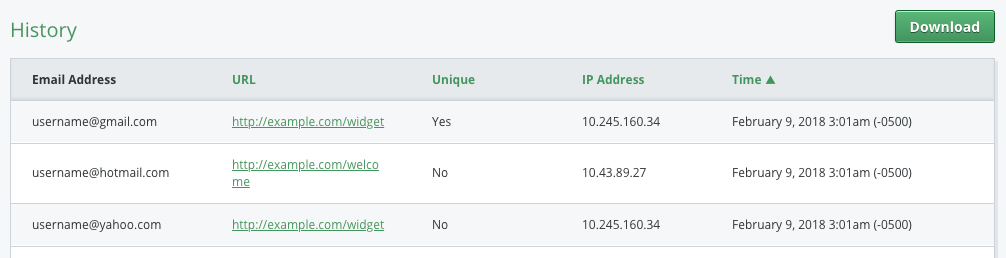
The “Download” link that appears next to the “History” table links to a CSV file containing the table’s data.
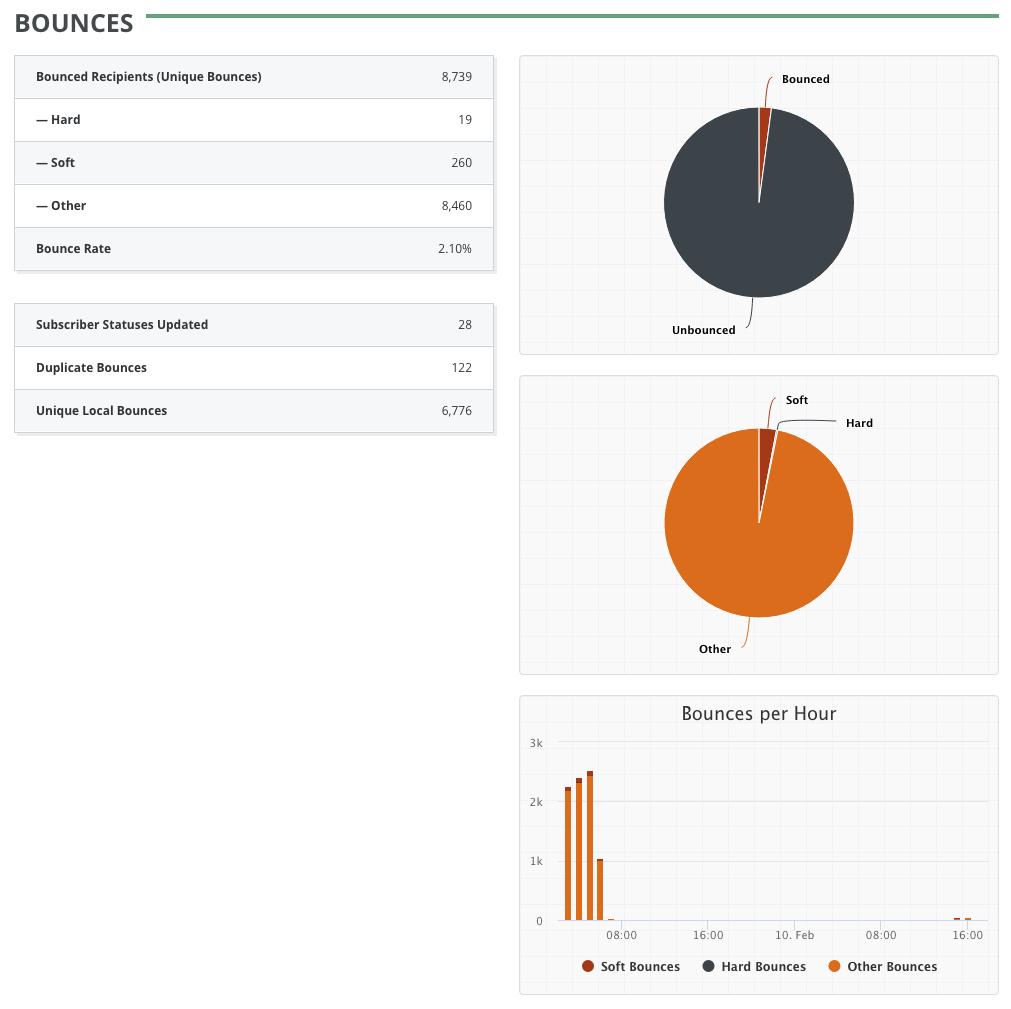
Bounces
This section provides statistics on bounces:
|
Bounced Recipients (Unique Bounces)
The total number of subscribers whose email address bounced. Each subscriber is only counted once. Each of these unique bounces is further classified as Hard, Soft or Other, as described below:
|
|||||||
| Bounce Rate |
The percentage of subscribers sent to whose email address bounced. |
||||||
| Subscriber Statuses Updated |
The number of subscribers who will not be sent to again because their status was changed to “Bounced” by the bounce processor. |
||||||
| Duplicate Bounces |
Total bounces minus unique bounces. |
||||||
| Unique Local Bounces |
The number of unique synchronous bounces. |
||||||
Bounce Code Breakdown
This table breaks bounces up into categories more detailed than the earlier Hard/Soft/Other classification, and reports on how many bounces of each type were logged:
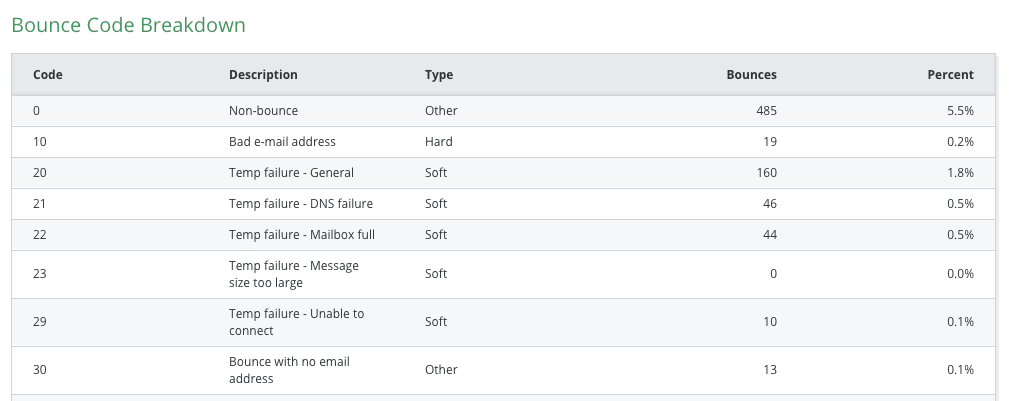
| Code |
A numeric code that GreenArrow assigns to this type of bounce. |
| Description |
A brief description of what this category of bounce represents. |
| Type |
The Hard/Soft/Other classification for this type of bounce. |
| Bounces |
The number of unique bounces in this category. |
| Percent |
The percent of unique bounces which are in this category. |
Domains with the Most Bounces
This table lists the 10 domains that the most unique bounces were received for, and provides details on each:
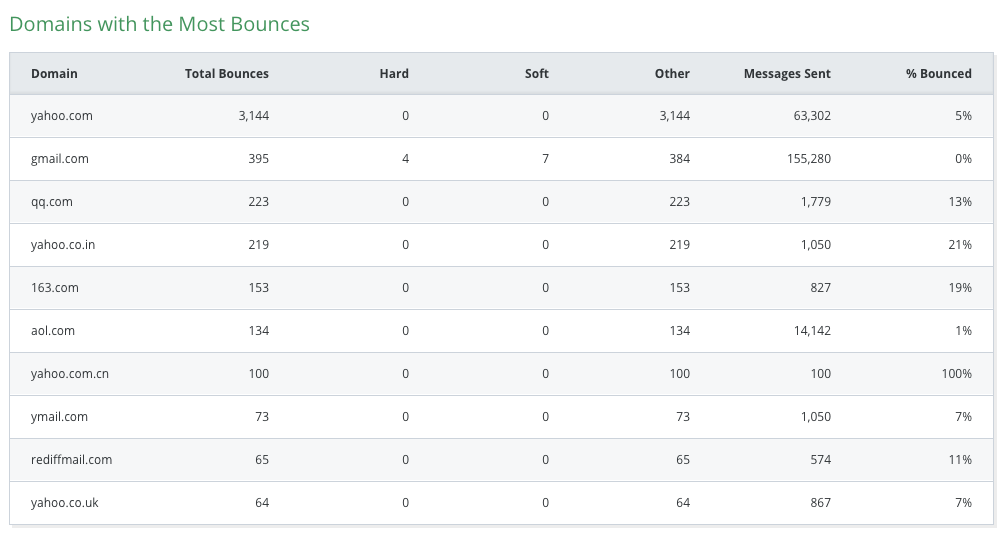
| Domain |
The domain name being reported on. |
| Total Bounces |
The total number of bounces that took place at the domain. |
| Hard |
The number of hard bounces at the domain. |
| Soft |
The number of soft bounces at the domain. |
| Other |
The number of other bounces at the domain. |
| Messages Sent |
The total number of messages that this campaign sent to the domain. |
| % Bounced |
Messages sent divided by total bounces. |
History
This table displays a list of individual bounces.
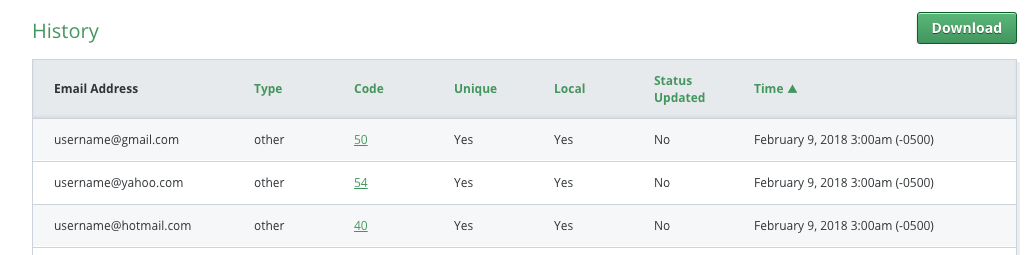
| Download |
Download a CSV file containing this table’s data. |
| Email Address |
The email address that bounced. |
| Type |
The Hard/Soft/Other classification of this bounce. |
| Code |
The numeric code that GreenArrow assigns to this type of bounce. |
| Unique |
True if this was the first bounce for this subscriber/campaign combination. False otherwise. |
| Local |
True if this was a synchronous bounce. False otherwise. |
| Status Updated |
True if the subscriber’s status was changed to “Bounced” as a result of this bounce. |
| Time |
The time that the bounce took place. |
Spam Complaints
This section provides statistics on spam complaints:
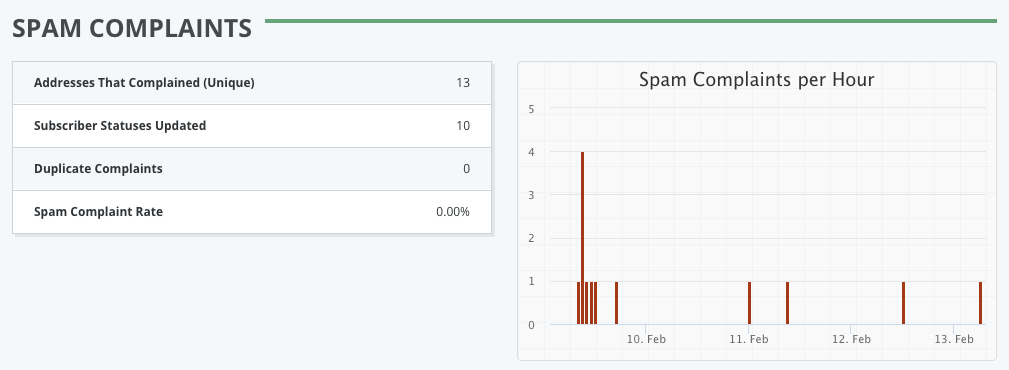
| Addresses That Complained (Unique) |
The number of subscribers who triggered spam complaints. Multiple complaints from the same subscriber are only counted once in this figure. |
| Subscriber Statuses Updated |
The number of subscribers who will not be sent to again because their status was changed to “Spam Complaint” by the spam complaint processor. |
| Duplicate Complaints |
Total complaints minus unique complaints. |
| Spam Complaint Rate |
The percentage of accepted emails which resulted in at least one spam complaint. |
Domains with the Most Spam Complaints
This table lists the 5 domains that the most unique spam complaints were received for, and provides details on each:
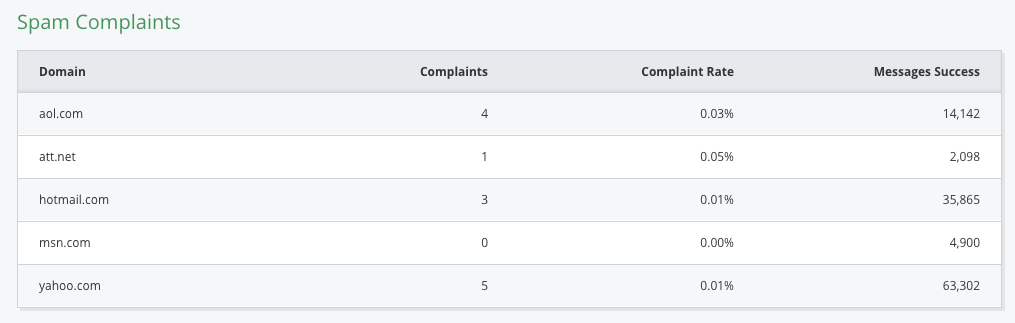
| Domain |
The domain name being reported on. |
| Complaints |
The total number of complaints that took place at the domain. |
| Complaint Rate |
Messages Success divided by Complaints. |
| Messages Success |
The total number of messages that GreenArrow successfully delivered for this domain to another mail server, and which GreenArrow did not later receive an asynchronous bounce for. |
History
This table displays a list of individual spam complaints:
| Download |
Download a CSV file containing this table’s data. |
| Email Address |
The email address that generated the complaint. |
| Unique |
True if this was the first complaint for this subscriber/campaign combination. False otherwise. |
| Status Updated |
True if the subscriber’s status was changed to “Spam Complaint” as a result of this complaint. Normally the value here is “True” unless either the complaint is a duplicate or the subscriber clicked an unsubscribe link before triggering the spam complaint. |
| Time |
The time that the complaint was received. |
Unsubscribes
This section provides statistics on unsubscribes. These unsubscribes normally take place when a subscriber clicks on an unsubscribe link within the campaign, but some subscribers can also trigger unsubscribes via the List-Unsubscribe header that GreenArrow Studio automatically inserts into each email:
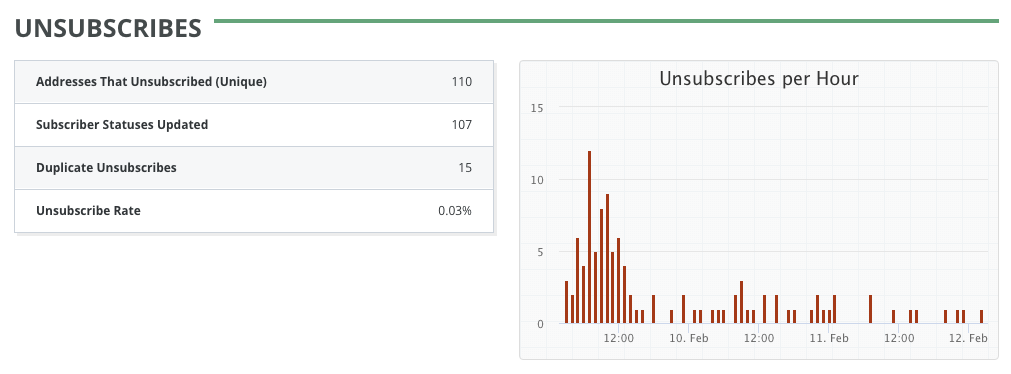
| Addresses That Unsubscribed (Unique) |
The number of subscribers who unsubscribed. Multiple unsubscribes from the same subscriber are only counted once in this figure. |
| Subscriber Statuses Updated |
The number of subscribers who will not be sent to again because their status was changed to “Unsubscribed”. |
| Duplicate Unsubscribes |
Total unsubscribes minus unique unsubscribes. |
| Unsubscribe Rate |
The percentage of accepted emails which had an unsubscribe link clicked at least once. |
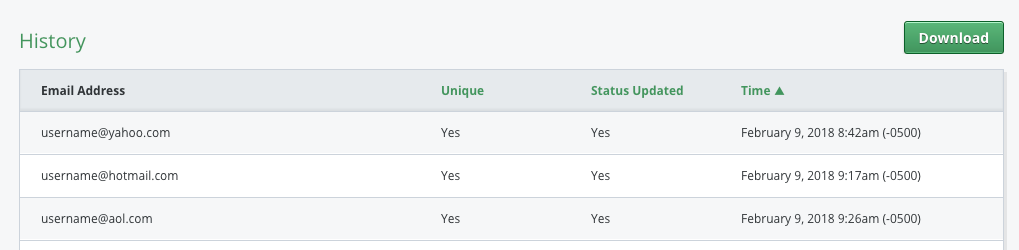
History
This table displays a list of individual unsubscribes:
| Download |
Download a CSV file containing this table’s data. |
| Email Address |
The email address that unsubscribed. |
| Unique |
True if this was the first unsubscribe for this subscriber/campaign combination. False otherwise. |
| Status Updated |
True if the subscriber’s status was changed to “Unsubscribed” as a result of this unsubscribe. Normally the value here is “True” unless the unsubscribe is a duplicate or the subscriber unsubscribe from another campaign after they were sent this camapign, but before they clicked its unsubscribe link. |
| Time |
The time that the unsubscribe was received. |